- Details
- Written by Gordon Prentice
In tomorrow’s Toronto Star former PC leader, Patrick Brown, boasts of his legacy. He says the Party was not left in a mess. There’s cash in the bank and the Party is much more diverse. Membership soared from 12,000 party members to either 136,000 or over 200,000 depending, he says, on who you believe.
But there is a darker side. Brown lied through his teeth about his finances to the Province’s Integrity Commissioner who said these lies were deliberate and not inadvertent.
So why should we now believe anything he says?

Brown says by-election wins triggered an avalanche of interest in becoming a PC candidate:
“We were not prepared as a party for the lengths people would go to win nominations. We had to shut down attempts to print fake ballots, produce fake ID’s, stop fistfights and even the stuffing of ballot boxes. I was beyond frustrated to hear these ongoing stories.”
This is Canada for goodness sake! Not Syria, South Sudan or Somalia. Stuffing ballot boxes is not something that is supposed to happen here.
We should be outraged.
For a while the PC’s interim leader, Vic Fedeli, was determined to root out the rot. Then the moment passed.
Brown makes it sound as if he, as Party Leader, was an innocent by-stander when in reality he was in it up to his armpits.
Often, he looked the other way, choosing to ignore the cheating, malpractice and fraud. He now tells us:
“We took steps to ensure these nominations were run fairly and free from abuse. I personally ordered the party to bring in PWC to observe and certify our nominations. I have been as shocked as anyone else to hear about allegations that a candidate stole private 407 data. In retrospect, I am increasingly of the opinion political parties are ill equipped to handle nominations and that it is time to have Elections Ontario manage this part of our democratic process.”
As usual, he is being economical with the truth.
Before Brown brought in Price Waterhouse Coopers he ruled that the nominations of the 64 candidates, already endorsed and approved, would stand even though many were challenged. PWC was brought in after the fact, checking on cheating in all nominations "going forward".
Here in Newmarket-Aurora Brown left the cheat Charity McGrath in place as the official PC candidate despite the resignation of the riding’s entire board.
On 28 May 2017, the provincial nominating committee told the Newmarket-Aurora riding Board it proposed to take no action on the documented allegations of cheating and fraud.
When Ford took over as Leader McGrath was dumped to make way for Christine Elliott.
That's how we ended up with Ms Elliott, the PC Leadership's three time loser.
This email address is being protected from spambots. You need JavaScript enabled to view it.
- Details
- Written by Gordon Prentice
Ford’s at it again.
Making up policy as he goes along. 
Now he is promising to exempt Royal Canadian Legion halls from property taxes.
But municipalities already have that power if they choose to exercise it.
Ford’s latest trumpet blast was prompted by NDP candidate Laura Kaminker who doesn’t much care for Remembrance Day poppies.
Ford leapt on the candidate’s comments and immediately rolled out his new commitment to exempt the Legion. It was a headline grab.
Pure Ford.
The policy commitment didn't rate a mention in Patrick Brown's "People's Guarantee".

The Globe and Mail’s Adam Radwanski comments today:
“The PCs, who at the moment are still best-positioned to win government but find the New Democrats unexpectedly breathing down their necks, have been trying hardest to make hay of the candidate controversies. That included, on Tuesday, delegating a pair of their candidates to decry the NDP’s nominees as “radical and extreme”; later the same day they announced a new pledge to spare legion halls paying (municipal) property tax, presented without detail and seemingly concocted solely to keep the poppy-related controversy alive.”
That hit the nail on the head.
Ford's Press Release says:
"While Ontario’s Assessment Act provides some exemptions on property taxes for certain organizations, the Ontario Command of the RCL does not qualify for the exemption."
It seems to me that the Assessment Act 1990 already gives a specific exemption to land that is used and occupied as a clubhouse by people who served in the armed forces. Municipalities have the power to exempt Legion Halls if they choose. (See below.)
If Ford wants to remove that discretionary power from Municipalities he should simply say so.
The mandatory exemption of Legion Halls from property taxes will come at a cost but, for many people, that Is a price well worth paying.
This email address is being protected from spambots. You need JavaScript enabled to view it.
Assessment Act 1990
Exemption for land used by veterans
6.1 (1) Land that is used and occupied as a memorial home, clubhouse or athletic grounds by persons who served in the armed forces of His or Her Majesty or an ally of His or Her Majesty in any war is exempted from taxation in the circumstances and to the extent described in this section. 2006, c. 33, Sched. A, s. 7.
Land in municipalities
(2) The council of a local or upper-tier municipality, as the case may be, may pass by-laws exempting land described in subsection (1) from taxation for its purposes on such conditions as may be set out in the by-laws. 2007, c. 7, Sched. 1, s. 1 (1).
Restriction
(3) An exemption under subsection (2) must not exceed 10 years but may be renewed at any time during the last year of the exemption. 2006, c. 33, Sched. A, s. 7.
Exception
(4) An exemption under subsection (2) does not affect the obligation to pay fees or charges that have priority lien status. 2006, c. 33, Sched. A, s. 7.
Update on 23 May 2018. I am told the Legion on Newmarket’s Srigley Street is exempt.
- Details
- Written by Gordon Prentice
The Progressive Conservative Party of Ontario is deeply corrupt.
Under Patrick Brown’s leadership there was cheating, ballot stuffing and voter fraud on an Olympian scale. The rights of ordinary PC members were casually ignored as the then Leader smoothed the path for his favourites. The National Post told us on 13 March 2018 that Brown:
“appointed candidates himself in about 60 constituencies and refused to hear appeals of those that were clouded by controversy.”
As newly elected leader, Doug Ford, told the National Post:
“There were a lot of indiscretions in a lot of nominations. I spoke to people who were disqualified the day before (the nomination election) and that’s not being transparent.”
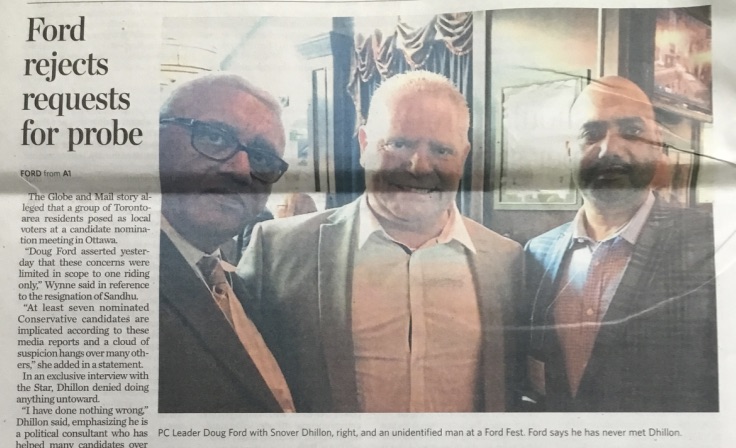
Now we have the jaw-dropping revelations from yesterday’s Globe and Mail which chronicles the disgraceful actions of the convicted fraudster Snover Dhillon who, by all accounts, hired himself out to people seeking PC nominations.
“Dhillon played a controversial role in a number of the candidate-nomination votes that have resulted in accusations of voter fraud, ballot stuffing and other irregularities.”
Now both the Liberals and the NDP are calling for a police investigation into PC nominations.
On top of all this we now have the scandal of Simmer Sandhu and the theft of identities from the privately-owned Highway 407 ETR. It is alleged 60,000 names, addresses and phone numbers were stolen from the company’s internal systems with the thief then distributing or selling the data to candidates in GTA PC nomination races. 
Until last Wednesday Simmer Sandhu – who was employed by Highway 407 ETR - was the PC candidate for Brampton East. He protests his innocence.
Sandhu has now been replaced by another Ford appointee, Sudeep Verma.
Ford refuses to back calls for a police probe.
Clearly Vic Fedeli didn’t root out all the rot.
Ford has now appointed 13 PC candidates including the notorious Meredith Cartwright who is running in Toronto Centre. She took the rap for hiring actors to masquerade as Ford supporters outside the TV studio where the Party leaders debated.
And he’s dumped nine candidates.
And six days away from the start of advanced polling on 26 May 2018, the official PC website still doesn't show a photograph of its candidate for Brampton North, Ripudaman Dhillon.
This email address is being protected from spambots. You need JavaScript enabled to view it.
Update on 22 May 2018: Snover Dhillon says PC candidates paid for memberships, breaking Party rules.
- Details
- Written by Gordon Prentice
There are nine candidates in the race to be the next MPP for Newmarket-Aurora. 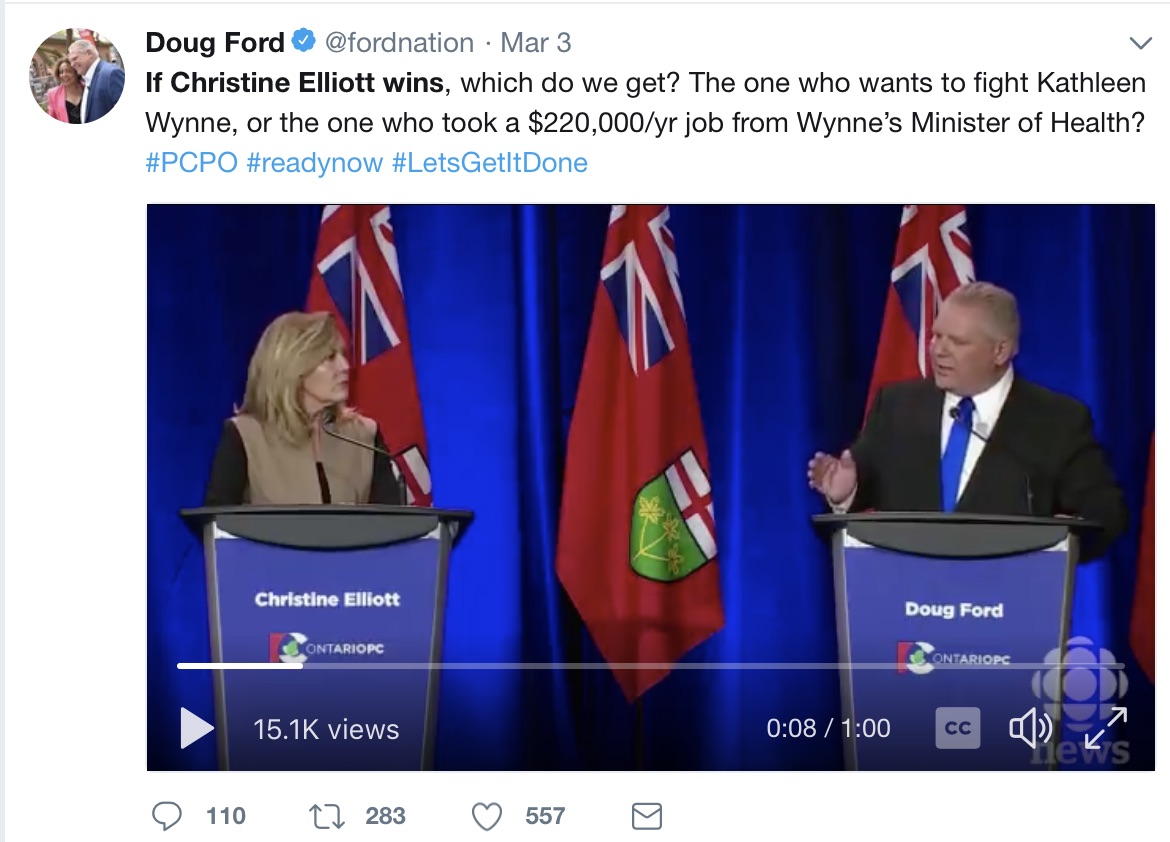
Chris Ballard, the MPP since 2014, has a fight on his hands to retain the seat given the reported surge in support for Doug Ford who, in the space of two months, has rebranded the PCs in the image of Ford Nation. Shallow sloganizing.
Ford is always ready to label his opponents as being in some way phoney when compared with him, the genuine article.
The PC standard-bearer in Newmarket-Aurora is the parachutist, Christine Elliott, who ran three times for the PC leadership and lost on each occasion. During the PC leadership debate on 1 March 2018 we heard this barb from Ford as he stares directly at her:
“If Christine Elliott wins, which do we get? The one who wants to fight Kathleen Wynne, or the one who took a $220,000 a year job from Wynne’s Minister of Health.”
Chris Ballard is an effective politician, capable and well-liked with deep roots in the area. Unlike Christine Elliott, he doesn’t need to consult Google Maps to find his way around the riding.
Melissa Williams is running for the NDP which has historically come a poor third in Newmarket-Aurora. She is hoping for an orange wave.
Bob Yaciuk, the leader of the fledgling Trillium Party, hopes to make an impact with his jolly vaudeville style but has zero chance of success.
Dorian Baxter, the legendary cleric/politician is running as an Independent this time. He, too, stands no chance of being elected but could pick up one or two per cent of the vote based on his previous showings.
We also have a Green candidate, Michelle Bourdeau.
Then there is Denis Gorlynskiy from the Ontario Moderate Party who can be expected to say nothing that would frighten the horses.
The Libertarians are putting forward Lori Robbins and, bringing up the rear, we see Denis Van Decker representing the None of the Above Direct Democracy Party. These minor parties provide colour and add to the gaiety of the nation but will not pick up more than a handful of votes between them.
Format useless
As it happens, I wandered along to the Aurora Chamber of Commerce “candidates’ luncheon discussion” at the Royal Venetian Mansion on Wednesday to hear what the candidates had to say.
The format was totally useless. The platform was top-heavy with eight candidates from two ridings (Newmarket-Aurora and Aurora-Oak Ridges-Richmond Hill) fielding soft-ball questions. The whole thing was overly-scripted with no zip or pizzazz. I don’t blame the candidates who were not allowed to interact or disagree with each other. Instead they recited chunks from their Party program (except for the PCs who don’t have one) making the whole event feel very stilted.
At least Elliott was there. PC candidates have been skipping debates all over Ontario. 
Chris Ballard lives here
How did they do? Chris Ballard plays a strong hand, reminding everyone that Newmarket-Aurora is his home – where he ran a business for 27 years and where he raised his family. He acknowledges that affordable housing is a big issue while, at the same time, recognising that many people have seen their biggest investment (their home) surge in value. He lists the actions taken by the Provincial Government but says more needs to be done. He talks about the problems facing renters.
The NDP’s Melissa Williams says an NDP Government will back buy Hydro One and spend $180 billion on infrastructure over the next decade. She moves on to talk about precarious employment. It is a shopping list tailored to be attractive to the traditional left-leaning voter.
On cue, Christine Elliott complains about high taxes and “astronomical” hydro rates. She talks about meeting an Aurora business person who says things are so bad here that she is thinking about moving to the United States. Yep. They don’t have any problems down there.
Fiscal Prudence
Elliott’s eyes light up as she talks about “fiscal prudence” without a hint of irony. She repeats Ford’s promise that there will be a Commission to find out the true state of the Province’s finances. During the campaign the incontinent Doug Ford has sprayed billions of dollars of extra spending into every corner of the Province without bothering to explain how he is going to pay for it all.
Ballard says there is good debt and bad debt. We all borrow to buy a house and lots of us borrow to buy a car to get to work. He says the Government is “investing” in the future, spending $190 billion in infrastructure, doing things – citing GO Rail – that should have been done decades ago. Spending to invest and not, I suppose, to splurge.
Get out of our way!
The leader of the Trillium Party, Bob Yaciuk, is the Court Jester, telling us that all our problems would be solved if the Government would just “get out of our way!”
He says this to gales of laughter. He promises to get rid of 30% of regulations and, after pausing for effect, tells us 50% or 60% or even 70% is possible.
Why stop there?
The Newmarket Chamber of Commerce breakfast with the candidates at the Cardinal Golf Club on 24 May will follow a different format. It also excludes Bob Yaciuk who is hopping mad about it all.
Hopefully the candidates will be allowed to debate with each other under the light-touch guidance of a moderator who knows her or his business.
There is another opportunity to hear the candidates in a “Social Issues Forum” hosted by the Holy Cross Lutheran Church from 7pm – 9pm on the 24th.
This email address is being protected from spambots. You need JavaScript enabled to view it.
- Details
- Written by Gordon Prentice
Doug Ford’s pledge earlier this week to slash gas prices by 10 cents a litre will mean $1.2 billion in lost revenue to the Provincial Treasury. 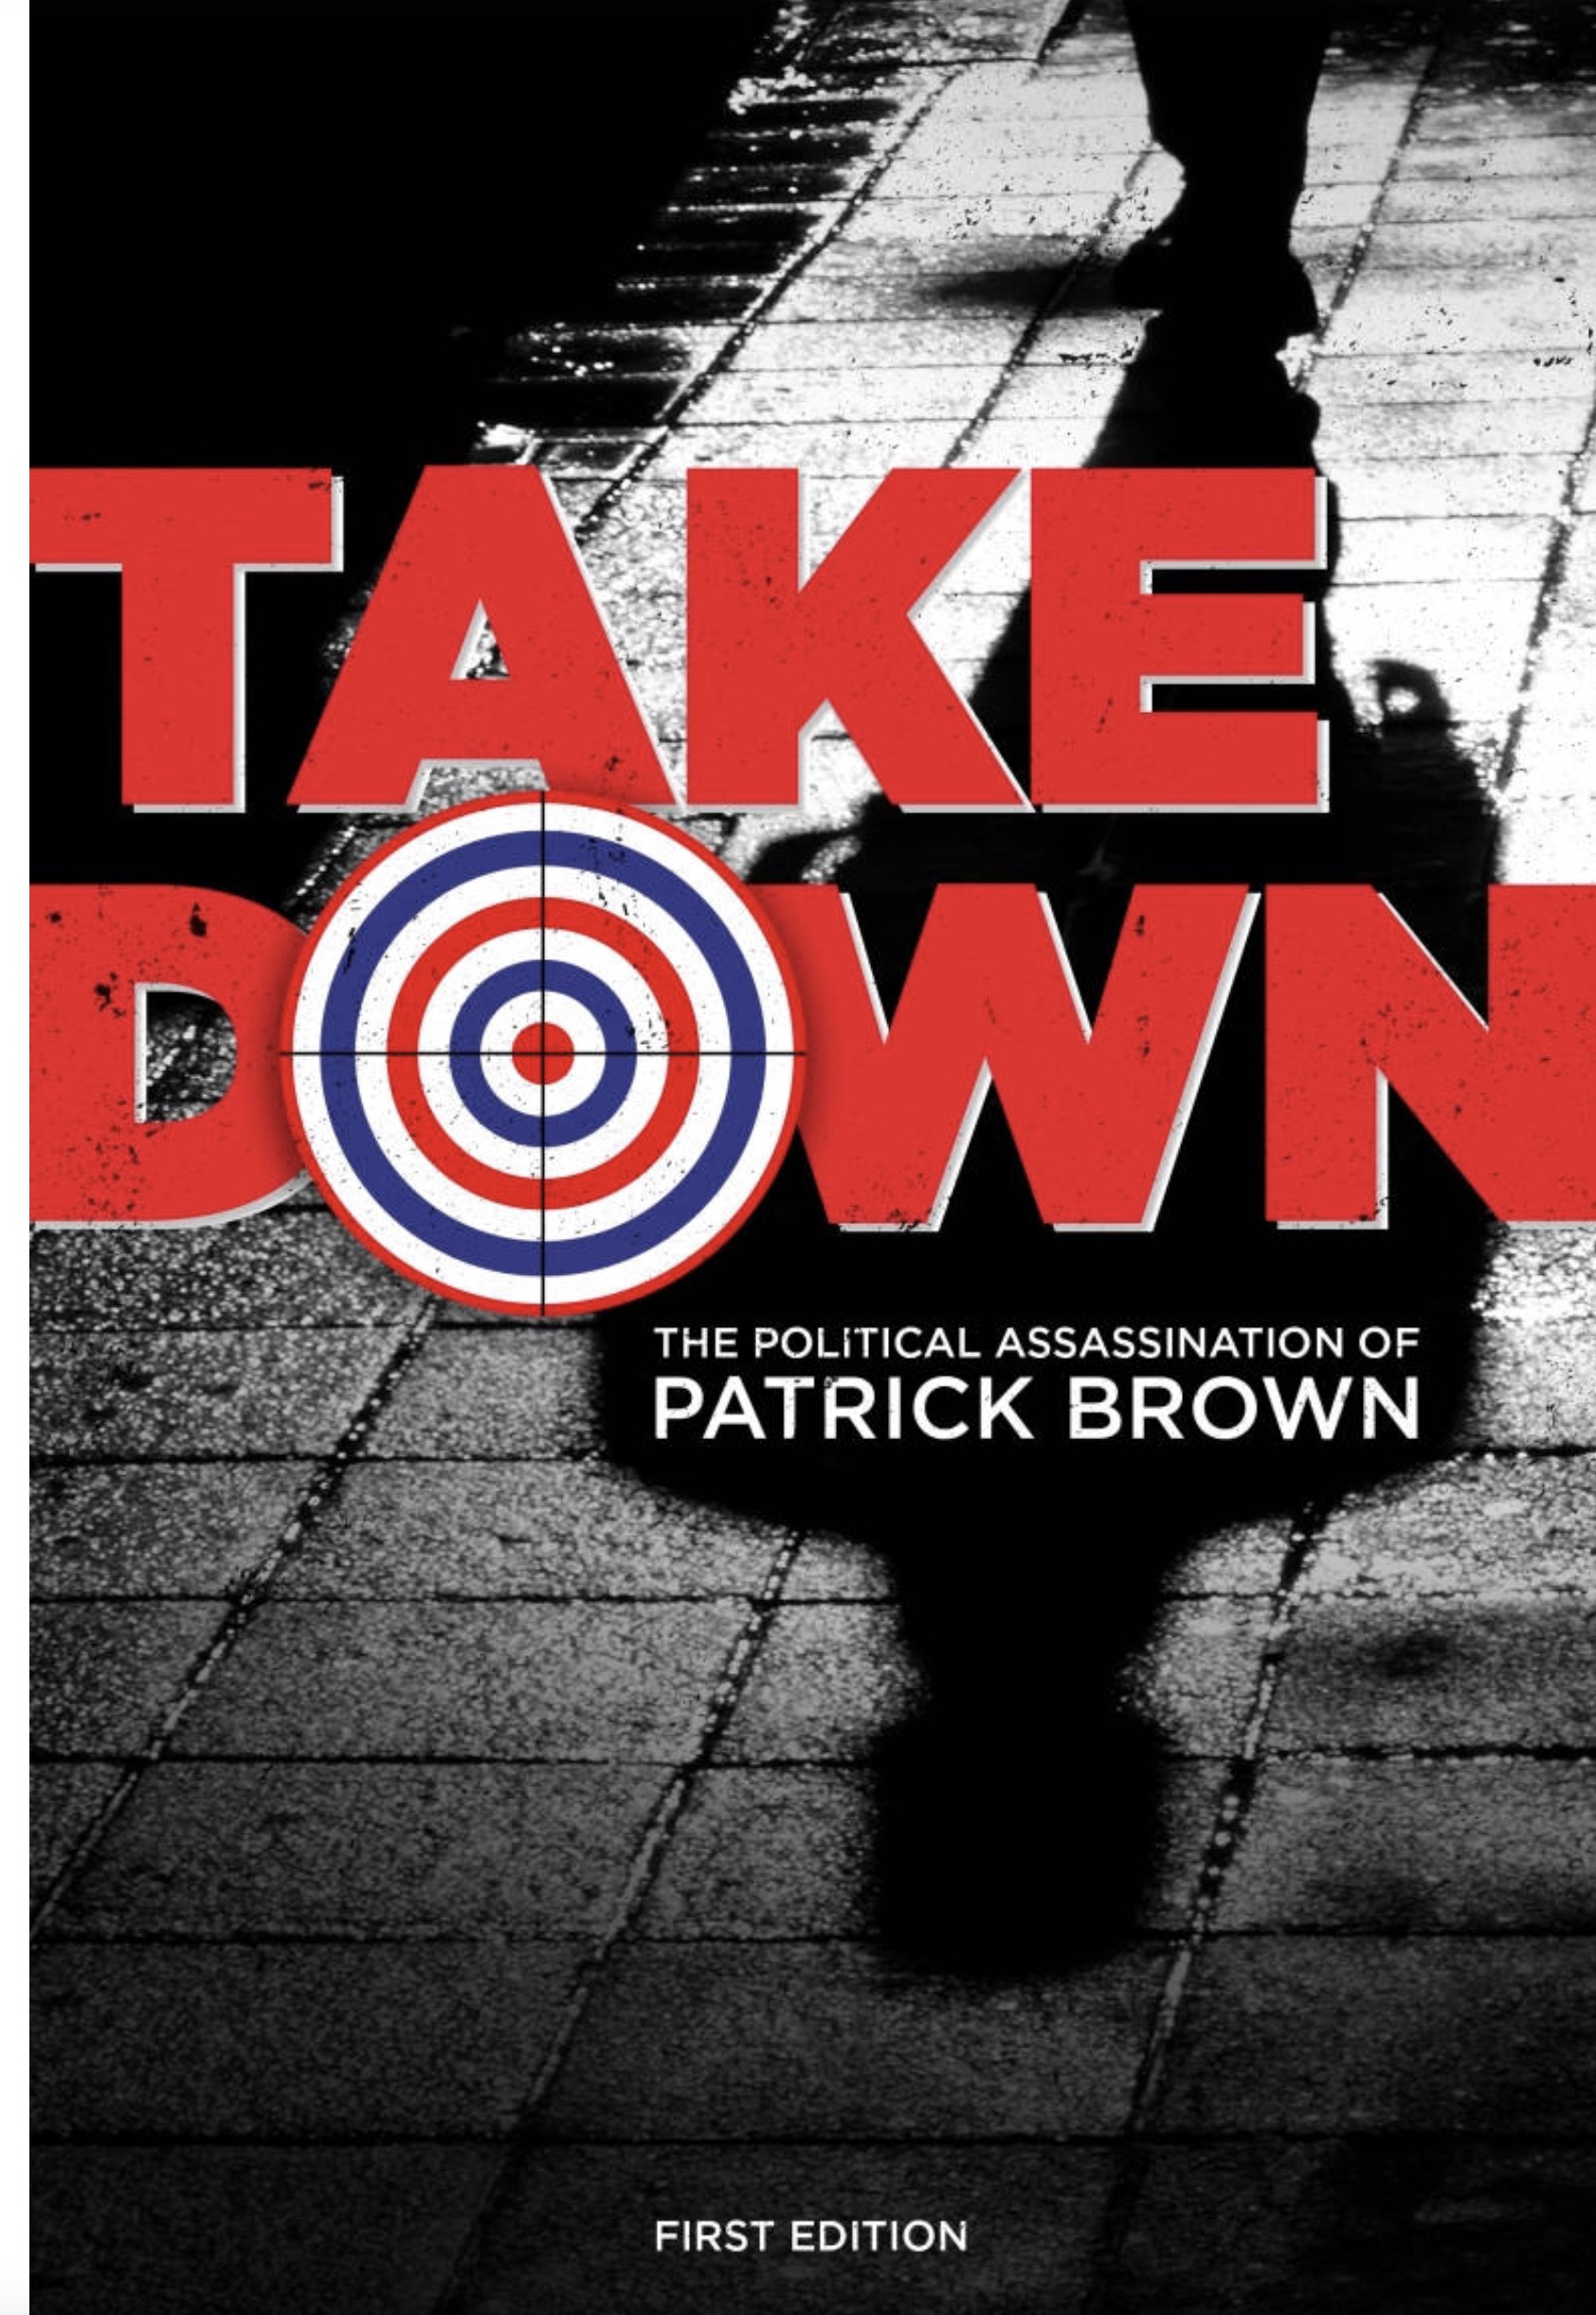
This promise is entirely new, plucked out of thin air.
He is making policy on the hoof again!
The cut in gas tax did not feature in Patrick Brown’s “People’s Guarantee”.
Political Assassination
And speaking of Patrick Brown, I see that he is planning to publish a book in November about his “political assassination”. I don’t know if it is fact or fiction. Probably a little bit of both.
I had largely forgotten about Brown but the prospect of his new revelatory book has rekindled my interest.
At first glance, there doesn’t seem to be a chapter on his tangled and very irregular finances. The Globe and Mail reminds us:
“Since leaving his post, Mr Brown was found to have broken Ontario’s ethics rules by failing to disclose a $375,000 loan from a close friend who later went on to become a Tory candidate. New nomination races were also held in a handful of ridings amid controversies about ballot-stuffing and fake memberships.”
(Of course, it is worth remembering that the PC parachutist, Christine Elliott, is only here in Newmarket-Aurora because her predecessor, Charity McGrath, was caught stuffing the ballot box with fake memberships.)
The Integrity Commissioner, the Honourable J. David Wake, found that Patrick Brown twice breached the Members’ Integrity Act 1994 in failing to disclose rental income from his personal residence in 2016 and 2017 and in failing to disclose a loan from Mr Jass Johal in the same two years. Johal went on to become the PC candidate for Brampton North. You can read the Integrity Commissioner's full report here.
Brown deliberately concealed the truth
The Integrity Commissioner says of Brown's deception:
“The seriousness of the breach was aggravated by the fact that it occurred in both the 2016 and 2017 statements and was not corrected at either of his personal meetings with me when his statements were reviewed. On all the evidence it is clear to me that the non-disclosure was deliberate and not through inadvertence.” (My underlining for emphasis.)
Jass Johal, who loaned $375,000 to Brown, was his adviser, dishing out business cards with the title “Advisor to PC Leader” with the logo and address of the PC Party. Johal went on to become the PC candidate for Brampton North in November 2016 after selling PC memberships on an industrial scale – 6,200. He was disqualified as PC candidate on 15 March 2018. (Seems to me that selling memberships in this way inevitably leads to cronyism and clientism.)
Secret Loan = a berth at Queen’s Park
The Commissioner says the arrangements made by Brown to get his down payment were “Byzantine in nature and disturbing on many levels”. The Commissioner writes:
“Mr. Brown explained that at the time that he received the Loan from Mr. Johal, he was unaware that Mr. Johal was interested in the nomination. He claims that he first learned that Mr. Johal was interested in being a candidate in Fall 2016.
Mr. Johal’s evidence on this point differed from Mr. Brown’s. He indicated that he became interested in running when Mr. Brown became Leader of the PC Party in 2015. He also stated that he did mention to Mr. Brown in 2015 that he was interested in running. “ 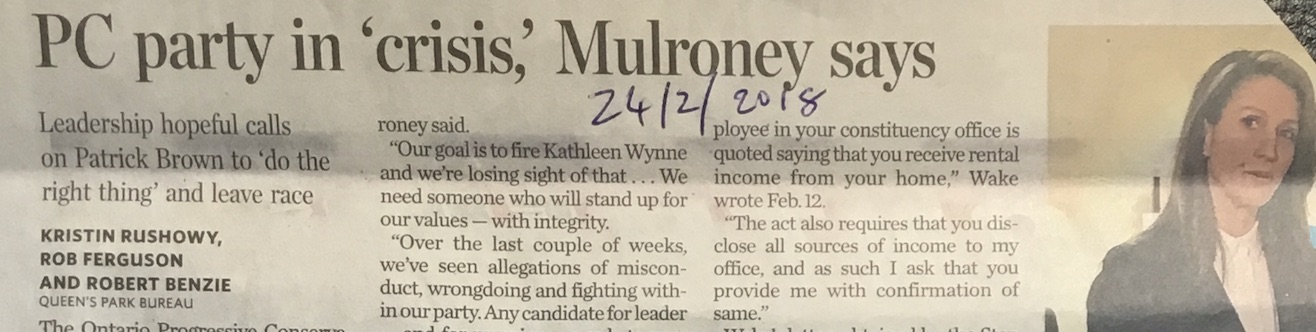
Does Brown seriously expect us to believe he was unaware of the fact that his own official adviser, Jass Johal – the man who secretly loaned him $375,000 – wanted to become a candidate for the Progressive Conservatives? Does Brown take us all for fools?
In late February Caroline Mulroney was urging Patrick Brown “to do the right thing” and drop out of the leadership race. He resigned as Leader then promptly threw his hat into the ring again. She said the PC Party was in “crisis”.
In a funny kind of way it still is.
This email address is being protected from spambots. You need JavaScript enabled to view it.
Page 154 of 288